
HF Markets Autochartist - Key Chart Patterns That Every Trader Needs To Know

Notice
This Post has ended its release period. Please check HotForex's latest information and campaign on HotForex's company introduction page.
HotForex - What's now?
We are no longer promoting HotForex. The information regarding to HotForex on the website '' maybe outdated. ref. HotForex
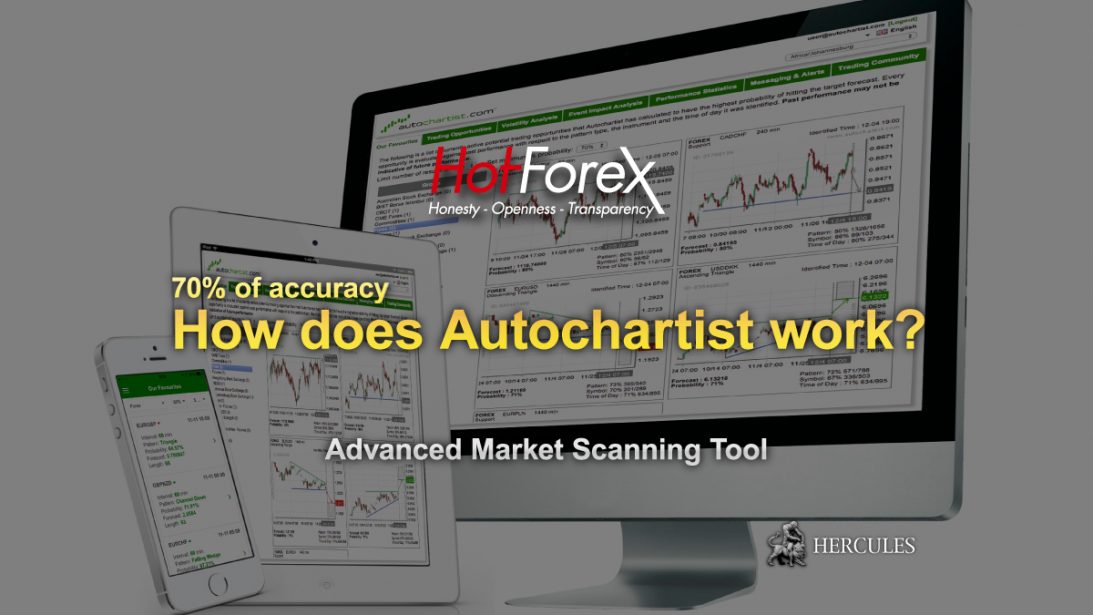
Sign up for HFM to access Autochartist
Save valuable time when reading through charts.
Autochartist scans a multitude of trading instruments in real-time and automatically identifies Chart patterns and Fibonacci patterns to never miss an opportunity again.
- Identifies three types of patterns: Chart Patterns, Fibonacci patterns and Key Levels. All are based on support and resistance levels.
- Monitors financial Instruments 24hrs/day.
- Presents all opportunities in the market regardless of the chart being viewed.
- Saves time and helps refine traders’ efficiency as it scans through tradeable patterns automatically.
- Gives access to multi-language email market reports and alerts.
- Can be installed on clients’ MT4 & MT5 Terminals to scan opportunities across all charts.
- Search functionalities and various filters allow users to form a custom-made watch-list.
- Offers volatility analysis as means of getting useful insight into instrument movements.
HF Markets newest free tool, Autochartist is fully customizable to your instruments and your preferred language, it scans your watch list and alerts you to opportunities in real-time as soon as a Chart or Fibonacci pattern is identified.
Constant monitoring, volatility analyses and multiple Market Reports mean you’ll never miss an opportunity again – it works 24 hours so you don’t have to.
Start using HFM’s Autochartist
Key Chart Patterns That Every Trader Needs To Know
A chart pattern is a distinct formation creating a trading signal or sign of future price movements. They are used to identify current trends and trend reversals triggering buy and sell signals. Even when we identify a chart pattern we must always be aware of fundamentals so we are not caught by surprise by a high-impact economic event taking place at the same time.
We generally have two charting patterns; the trend can continue or there can be a complete reversal of the trend. A continuation pattern generally results, as the name would suggest, in the trend continuing in the same direction once the pattern is completed. It is generally a pause in price action and the duration of the pause can vary. For reversal patterns, the previous trend will reverse once the pattern is completed, so will head in the opposite direction of the original trend.
We will start with a continuation pattern namely the triangle. There are three different types of triangles that you will spot when reading the charts; symmetrical, ascending and descending. We are looking for the narrowing or converging of the price range, with progressively higher lows and lower highs closing to form the apex of the triangle. The closer to the apex, the higher the probability of a breakout as we can see in the graph below.
Go to HotForex Official Website
Continuation Patterns
1. Symmetrical Triangle

So we are looking at a symmetrical triangle which I found in the USD/JPY chart, where both sides of the triangle are sloping towards an apex. We start with larger oscillations in price action which condense and become tighter forming a point or an apex. As the sides provide resistance and support levels, when we see the price break through this level, it indicates the end of this pattern and we can trade in the direction the market was heading. In this case, the direction was upward.
We can use volume to confirm the breakout, as a rise in volume indicates increased interest in the pair and there is strong conviction behind the move.
Start using HFM’s Autochartist
2. Ascending Triangle

We move to the ascending triangle or wedge, again we have a continuation pattern normally found in bullish or up trending markets and we have narrowing price oscillations defined by a horizontal top line, with at least two peaks within the triangle, closing towards a point again.
We can see from the graph that we have a number of reaction highs, so when you are looking for this type of pattern the reaction highs hit a similar level- you will find you can draw a straight line across both highs. This will be combined with an ascending bottom line, with successively higher lows though there should be some distance between the lows. Since we are looking for the trend to occur we are waiting for the pattern to come to completion and are expecting an upward swing. As the pattern develops, volume usually contracts. When the upside breakout occurs, there should be an expansion of volume to confirm the breakout. We spot a breakout through the top horizontal line giving us an indication that we may want to come into a buy position as the resistance level turns into a support.
Go to HotForex Official Website
3. Descending Triangle

We now move to the descending triangle which is a bearish formation which usually forms from a downward continuation pattern. So we are looking for at least two reaction lows on the horizontal bottom line and an upper descending trend line with at least two reaction highs are required to form the upper descending trend line. When we look at the chart we see it is a mirror image of the ascending triangle except that we have an upper descending trend line with 1 or 2 reaction highs, each having successively lower highs. There is a lower horizontal line where the price is unable to break through lower resistance, even with a series of reaction lows. Again as with the ascending triangle, the breakout normally occurs around the apex of the triangle. When the downside break occurs, there would generally be an expansion of volume for confirmation.
Start using HFM’s Autochartist
4. Flag Pattern

We will go on to other type of continuation pattern. Now we will have a look at flags, which generally applies to the middle of the trend where there is a slight pause in the trend in the opposite direction before the trend continues. You will notice that this does not have the swings or oscillations up and down as the trend channel would. The movement can be contained between parallel lines and (normally) only lasts a few bars. So we can see from this chart that we have several short duration flags throughout this upward trend. Each bearish flag is followed by a breakout. We can identify the end of the pattern by a rise in volume indicating buying pressure after the pause. The breakout represents the continuation of the upward trend and should initiate buy positions.
Reversal Patterns
The most popular and arguably, the easiest to spot is the head and shoulders pattern. By definition, we use a reversal pattern as a signal that the trend is due to reverse. The standard head and shoulders pattern forms at the top of an upward movement in the market and suggests the trend is coming to the end of its run. The patterns itself consists of, as the name suggests, a head and a neckline with a left and a right shoulder. Each shoulder consists of a high and a low.
So we start with the left shoulder where the trend may at first appear to have reached a high, but we will know the distinct average because we have already looked at the trend that is applicable for this timescale in the GBP/CAD. So market drops down to a resistance level at around the 1.82 level and bounces back up for the second rally, eager traders will jump on this rally rushing into buy positions. We see that the market reaches a price high at the top, here; with less aggressive buying as the bulls supply line has started to collapse.

Traders who had taken long positions on the rally start to experience pain as short sellers take over and we see the downward pressure along the neckline, more and more traders start selling their positions. The right shoulder tends to be a lower high so it is unlikely to be broken until the uptrend resumes. We can also add volume to the graph to confirm a decreasing interest in upside moves. We are looking for the break of the 1.82 support level. Once this level is breached we look to come into our sell positions.
So the inverse head and shoulders pattern is characterized by the reversal of the downtrend as opposed to the uptrend we saw with the standard head and shoulders pattern. The main points to look for are the first price fall and then a rise, followed by another price fall below the last trough, and then another rise and finally the price falls again but not as far as the last trough (shown by the red line). It is basically a sign that the downtrend is struggling to continue and short sellers are losing the battle at the bottom the market.
So we start off with a descending trend and some choppiness down at the left shoulder as oversupply and dropping prices encourages buyers to take call positions. The second trough represents the lowest trough, before another rise in prices yet there are no significant buyers to drive the market through to the reversal, which results in a slightly less significant pullback, before we see the market step in and drive the reversal which we can identify by the break through the neckline (just below the 114.30 price level). So we have confirmation to come into buy positions as this marks the beginning of the upward trend.

Let’s now talk about the final reversal pattern- the exhaustion gap. This is a pattern that takes place in the middle of the trend and is a reflection of exhaustion. Generally, it is a very temporary gap in the market and is normally filled when the market recovers from losing steam and there is again upward pressure on the price. Price retraces to the original resistance level indicating the fill of the gap. When price turns to original pregap level and the resistance then becomes the support. We then look for the candle which signals the gap fill (just above the 1.288 price level). The reasons gaps can occur is due to technical and fundamental factors such as release of earnings data which cause a jump in the share price for example.

So when you come across a gap in the market like this GBP/USD chart you can confirm that it is in fact an exhaustion gap as price action jumps to a new price level as there is a pause/ exhaustion mid-trend. At the bottom of the last candlestick we use a resistance line or a gap fill line for which we will target as a signal to come into the market. The top of the candlestick that marks the end of the gap and represents a resistance line- is our signal. So as soon as we break through the gap fill line, we have a buy signal.
Start using HFM’s Autochartist
Statistical Indicators
Now we are going to move on to statistical indicators and have a look at how we can use them to inform our trades. It is important to note that using more than one indicator in combination will be a more successful strategy than using one in isolation.
We start with Bollinger bands. Bollinger bands consist of a centre line and 2 price channels or bands. The bands represent standard deviations of the asset, which change as volatility increases or decreases. The indicator is generally used to see the trend better as the exponential moving average filters price action, so that the latest data is given more weight. It is thought that the asset is overbought when it continuously touches the upper Bollinger band. If it continuously touches the lower Bollinger band, the asset is thought to be oversold, triggering a buy signal. The upper and lower bands could be considered price targets if the price hits the lower Bollinger band and crosses above the 20-period moving average (the middle line) then the upper Bollinger becomes the price target. In a strong upward trend the price usually fluctuates between the upper band and the 20-period moving average. When it crosses below the 20-period moving average this warns of a trend reversal, to the downside.

The second indicator is the Relative Strength Index or RSI, a momentum indictor which compares the magnitude of recent gains to recent losses to determine overbought and oversold positions of an asset (average number of days up closes/average number of days down closes). Momentum is important as it identifies the strength of the trend. It is a scale form 0-100. Overbought conditions are signified by reaching the 70 level, meaning the asset is considered overvalued and may be a signal for a pullback. At the other end of the scale, if RSI approaches the 30 level it is deemed oversold and considered undervalued, hence price may rise from here. As we see in the chart below, when RSI touched the 70 line, price action began to move downwards and when RSI hits the 30 support level, price tends to move upwards.

Moving Average Convergence Divergence (MACD) is another momentum indicator which follows the trend and shows a relationship between moving averages of prices. It is calculated by subtracting the 26 period exponential moving average (EMA) from the 12 period EMA. A 9 day EMA of the MACD, called the signal line is plotted on top of a MACD line, which serves as a trigger for buy and sells signals. We are generally looking for crossovers as buy or sell signals. A crossover the zero line to the upside indicates that sentiment for the asset has turned more positive. By contrast, a break below the zero line indicates that momentum has turned bearish or a downward reversal may be about to take place.

Start using HFM’s Autochartist
Support And Resistance
There are a number of different indicators that can be used to establish support and resistance levels, namely, moving averages, trendlines, whole numbers and Fibonacci. Support in essence, provides a stop to prices moving lower and resistance levels stop prices going higher. The strength of the support or resistance level is determined by how many times price action bounces back from it. As such, they can provide effective exit and entry points for traders. They give indication of a high conviction to sell or buy the security at certain price levels. Below we can see how specific price levels impact the direction of the currency pair. When price approached a previous resistance line at the 1.242 price level, it began to retrace as this represents a psychological level for the market.

Go to HotForex Official Website
Fibonacci Retracement
The indicator consists of lines of support of resistance at key mathematical levels which price action may hit before continuing the move in the original direction of the trend. The levels are measured against a trend line from a swing high to a swing low. The levels act as buy or sell signals as pullbacks in an uptrend to a specific retracement level, can indicate a buy opportunity or a rejection of a specific resistance level when price pulls back on a downtrend, can be a sell signal. In the graph below, we can see from the red candle that there is a potential pullback in the uptrend. If the pullback reaches one of the static support levels we may use that as an indicator of a buying opportunity.

Moving Averages
Moving averages can act as support and resistance levels which contain price action in a certain direction as denoted by the arrows below. Moving averages can also indicate strong conviction from buyers or sellers to move price action in a certain direction, generally signalled by a break of the moving average to the upside or downside.


