
Categories
Open Axiory Forex account and Get "Autochartist" Market Scanner for free
- Market Scanner “Autochartist” is now available for free with Axiory
- What is Market Scanning (Technical Analysis)?
- Why you should use Autochartist?
- Merits of Technical Analysis by Autochartist
- Technical Analysis – 3 things be aware of
Market Scanner “Autochartist” is now available for free with Axiory
Autochartist is a plugin-tool available for MetaTrader4.
The market scanner “Autochartist” look for trading opportunities automatically for traders.
It is now available for free with Axiory!
Autochartist continues to work 24/7 automatically, and look for trading signals and provide them to traders by analyzing 3 aspects (Chart Pattern, Fibonacci Pattern and Key Level) of thousands of financial markets.
Autochartist also provides volatility analysis.
By referring to these information, traders can trade and setup take profit and stop loss levels with confidence, and make smarter investment decisions.
Get MT4 with Autochartist for free
What is Market Scanning (Technical Analysis)?
Technical analysis is forecasting of price changes in the future, based on the analysis of price changes in the past.
It is based on the analysis of time series of prices, i.e. charts.
Many charts are used in technical analysis to display prices in the course of time, and the analysis itself is based on the mathematical and statistical calculations.
In addition to price series, Autochartist’s technical analysis uses information on trading volumes and other statistics.
Technical analysis does not consider the reasons why the price changes its direction (for example, due to low stock returns, fluctuations in the prices of other goods or other conditions change), but only takes into account the fact that the price is already moving in a certain direction.
From the point of view of a specialist in technical analysis, you can get profit in any market, if you properly and timely recognize the trend and open a position in the direction of the trend, and then close a trading position in time.
So, if the price fell to the lower limit, you should take the opportunity and open a position for purchase, and if the price has increased to the upper limit and turned – open a position for sale.
Pretty much like weather forecasts, technical analysis cannot predict the future price with 100% accuracy.
Autochartist’s Technical analysts use technical analysis in order to inform investors what will “most likely” happen in the market in the future.
Technical analysis is used for shares, indices, commodities, futures, or for any standardized trading instrument, the price of which is formed naturally by the interaction of supply and demand.
Why you should use Autochartist?
There are many reasons why Autochartist has become one of the most popular market scanning tool.
1. Analysis Skill Set
Autochartist analyses a large amount of data by using Chart pattern, Fibonacci patter and Key levels and volatility.
You can also customize the settings to suit it to your trading strategy.
You may need to study how to use the Autochartist first, but the tool will eventually save your lot of time and be efficient for your future profit.
Autochartist has prepared video tutorials for beginners too.
2. Saving your time
Autochartist never misses a trading opportunity.
The tool will notify all movements and trading opportunities to traders everyday with non-stop.
You won’t have to spare your time for technical analysis anymore.
3. Prediction of future market price
If the possibility of a market price reaching to a certain price in the near term is more than 70%, Autochartist will draw prediction zone with completed pattern for traders.
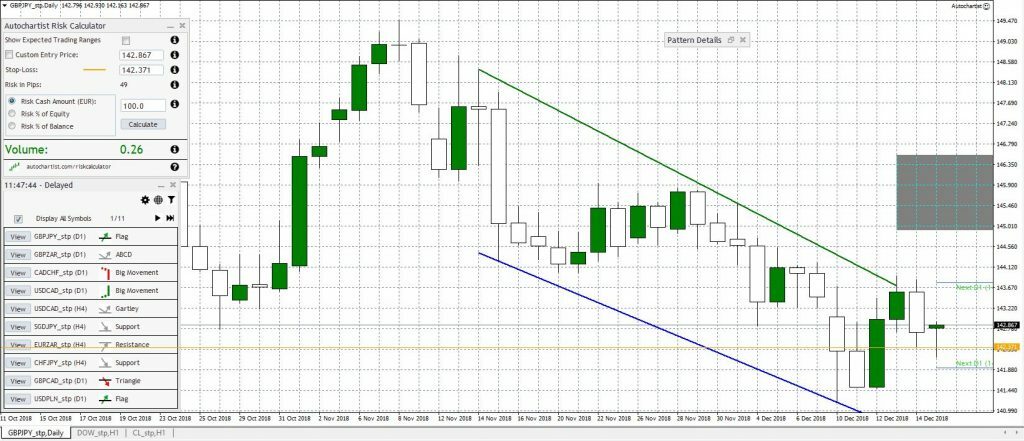
Trading opportunity prediction zone is described like in the screenshot above.
This is simply predicting the future market price.
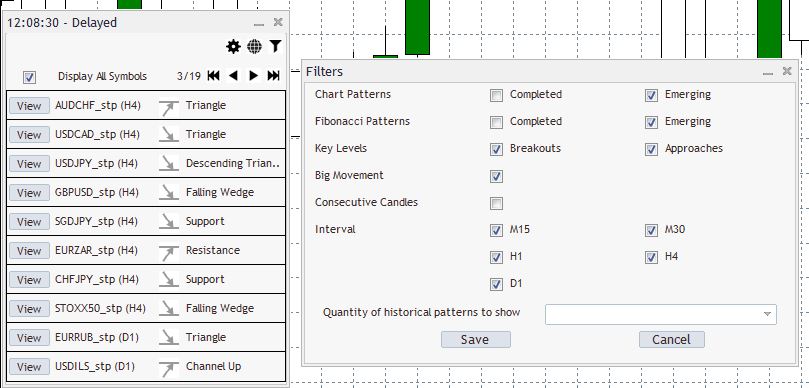
4. Customize according to your trading style
You can customize Autochartist so the tool will be suited to your trading style.
Autochartist is suited for both breakout traders and swing traders, and it will specify the support and resistance lines for you.
5. Available even for Demo accounts
With Axiory, you can use the Autochartist even for Demo trading accounts.
To use the Autochartist, you may follow the instructions to install.
Autochartist Installation Guide
Merits of Technical Analysis by Autochartist
Now that Axiory offers Autochartist’s market scanning tool for free, there is no reason that you don’t use the tool.
But how the technical analysis through Autochartist’s market scanning can help you to generate profits?
We have summarized 5 advantages of using Technical Analysis of Autochartist.
1. Technical analysis focuses directly on price
In technical analysis, in order to forecast the behaviour of the price or its direction in the near future in the most appropriate and accurate way, two factors should be taken into account.
These are current price and features of its behaviour in the past.
Modern technical analysis experts believe that it makes sense to focus on the price despite the fact that the market may give unexpected unpleasant surprise.
And in many situations, it is usually possible to recognize the signs foreshowing a particular change.
2. Supply, demand and price behaviour
Many technical analysts use opening price, closing price, maximum and minimum in the analysis of a tool.
In each of these four prices there is useful information.
Individually, they do not tell you much about this instrument, but in the aggregate these 4 prices can clearly show the behaviour of supply and demand in the market.
This “fusion” in the form of “bars” or “candles” shown in the charts already has powerful analysis capabilities.
For example, the model analysis in the form of systematic formations of single and groups of candles has a history of more than five centuries, from the time when Japan’s rice was traded on the stock exchange.
3. Support and Resistance
A simple visual analysis of the charts of financial instruments allows you to define and allocate the so-called support and resistance lines.
They can be identified by specific clusters of prices in a certain confined space of the graph-corridor.
Such formations indicate that supply and demand are in a temporary state of unstable equilibrium.
And sooner or later, it will lead to potential exit of price from these zones, and thus it will provide an opportunity for profit.
Here, accordingly, if the price has risen above the upper line of the corridor (resistance line), the demand wins (“bulls”).
If the price has fallen below the bottom line of the corridor (support line), then supply wins (“bears”).
4. Graphical display of the price
It’s hard to overestimate convenience of evaluation of the financial instrument behaviour on the graph of its price.
The graph is a simple and convenient way to display the history of the instrument price.
Especially, considering advanced possibilities of modern analytical programs available to any interested person.
Taken together, the graph allows estimating behaviour of prices before and after any major event, past and present variability, history of trading volumes, dependence of the instrument on the market.
5. Entry into the market
Another important point is that techniques and methods of technical analysis allow picking the best time and place to enter in a trading position in the market.
This feature is also widely used by the adherents of fundamental analysis, who use it to decide what to buy, and use technical analysis to decide when to buy.
The optimal entry into the market can have a significant impact on the profitability of the operation and it is technical analysis that will help you detect necessary turning points.
Technical Analysis – 3 things be aware of
Conducting technical analysis can help you understand the markets better and how the market will move in the near future.
But there are aspects that technical analysis cannot cover and you should be aware of.
1. Possible subjective discrepancies in analysis
Like any other type of analysis, technical analysis is quite subjective, and therefore in professional circles of financiers there is a joke that there are as many forecast options as there are technical analysts.
It is important to keep in mind when analysing the graphs that the current analysis may be influenced by certain professional and psychological preferences of a certain person.
If, for example, an analyst is a buyer (bull), then he will see signs for purchase where they may not be.
If the analyst is a seller (bear), then the same will happen in relation to sale.
So, often, two analysts may see different trends on the same graph.
And what is often interesting (especially watching public speaking of analysts on TV) is that one can always find support for his findings and coherent logic reasoning;
2. Effect of delay
Often technical analysis is accused of giving signals too late.
By the time the technician detects and confirms the trend, most of the changes will already be behind us, and the risk reward ratio will be not so great.
Dow Theory is often criticized in regard of tardiness;
3. Exceptions
In fact, not all the figures and tenets of technical analysis work in 100% of cases.
As with everything in life, there is a significant difference between theory and practice, in life a trader or analyst will encounter surprises in the market, therefore optimal in these situations is the model of the deep analysis of the behaviour of a particular instrument, with features of signals of technical analysis inherent to it.
-
Official Site
CFD Service. Your capital is at risk.
- Open an Account
- Login
- Detail
- Review


