
Categories
Technical Analysis - XAU/OIL Gold price in terms of oil is rising - 2016-07-15
Oil prices are declining as rising output still outstrips global demand. At the same time increased uncertainties in global financial markets after Brexit support demand for haven assets including gold, resulting in rise in XAUOIL . Will the price continue rising?
Oil has been declining after rebounding from multi-year low it hit in January.
It has rallied more than 70% since then on the prospect of global demand and supply re-balancing as US output declined in recent months. On Wednesday Energy Information Agency data showed that US oil production rose by 57000 barrels to 8.485 million barrels a day last week. A more negative development for oil was the rise in US gasoline supplies which increased by 1.2 million barrels last week.
It was a negative surprise since in the peak of summer driving season a drop in gasoline stocks was expected. And while US crude inventories fell, the 2.5 million barrels decline was smaller than expected. A higher US crude output was preceded by rising US rig count in 5 out of last 6 weeks. Canadian and Nigerian oil output has also been rising as production is recovering after outages caused by wildfires and militant attacks.
With global production rising inland storage are overflowing and floating storage on tankers has risen to seven year highs. At the same time crude imports in China hit a five-month low in June at around 7.5 million barrels a day according to the General Administration of Customs.
Increasing global crude oil output, weak US demand and declining Chinese exports all point to lower oil prices ahead, contributing to recent bearish sentiment for oil. At the same time gold has been advancing since the start of 2016 as Federal Reserve adopted a cautious stance on monetary tightening after the first interest rate hike in December 2015.
The UK decision to leave the European Union increased uncertainties in global economic outlook, boosting the demand for haven assets including gold. After the Brexit investors were betting that the Federal Reserve could cut interest rates this summer instead of a rate hike as expected previously. But better-than-expected June non-farm payrolls assured the markets US economic recovery has not stalled and the Federal Reserve may still implement a rate hike this year if inflation rises toward the target 2% level from current reading of around 1%.
Given the increased uncertainties for EU economies and slowing Chinese economy it is not likely Federal Reserve will hike rates soon which would be bearish for gold. Thus the price for the XAU/OIL is expected to rise given bearish sentiment for oil and considerable uncertainties for global economic outlook.
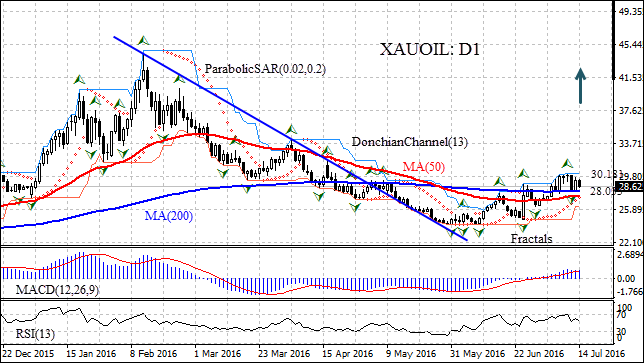
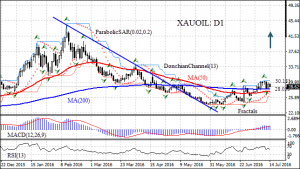
On the daily chart the XAU/OIL: D1 has been rising for over a month after oil price started pulling back from eight-month high. The price is above the 200-day and 50-day moving averages MA(200) and MA(50).
The Donchian channel is tilted upward indicating an uptrend. The Parabolic indicator gives a buy signal. The RSI oscillator is above the 50 level and has not reached the overbought zone. The MACD indicator is above the signal line and the zero level but the gap is falling which is a bearish signal. We expect the bullish momentum will continue after the price breaches above the upper Donchian bound and fractal high at 30.181, which can be used as a point of entry for a pending order to buy.
The stop loss can be placed below the last fractal low at 28.033. After placing the pending order, the stop loss is to be moved to the next fractal low, following Parabolic signals. By doing so, we are changing the probable profit/loss ratio to the break-even point. If the price meets the stop loss level at 28.033 without reaching the order, we recommend canceling the position: the market sustains internal changes which were not taken into account.
| Position | Buy |
|---|---|
| Buy stop | above 30.181 |
| Stop loss | below 28.033 |
This overview has an informative and tutorial character and is published for free. All the data, included in the overview, are received from public sources, recognized as more or less reliable. Moreover, there is no guarantee that the indicated information is full and precise. Overviews are not updated. The whole information in each overview, including opinion, indicators, charts and anything else, is provided only for familiarization purposes and is not financial advice or а recommendation. The whole text and its any part, as well as the charts cannot be considered as an offer to make a deal with any asset. IFC Markets and its employees under any circumstances are not liable for any action taken by someone else during or after reading the overview.
-
Official Site
CFD Service. Your capital is at risk.
- Open an Account
- Login
- Detail
- Review (62)


