Categories
Corona Virus Market Volatility - What's the best strategy to trade through?
What's the market trend during Coronavirus pandemic? Case studies and the new market trends.

- Be alert, Not panicked.
- Is it a good time to trade?
- Buy when there’s blood on the streets
- Anatomy of the market
- What will the new bull run look like?
- What a time to be alive!
- Market Volatility and Price Behavior
- DOW Jones – The bigger picture and What’s next
- Now it’s your turn
- The Axiory Market Analysis Team
Be alert, Not panicked.
This simple advice given to everyone during the COVID-19 outbreak applies to traders too.
A trader should always be cautious, perhaps a little more so at times when globally impactful changes are happening on a daily basis.
Aside from this extra pinch of caution, there’s no need for panic buying or selling.
Keep calm and study the markets as you would at any point in time.
With this in mind let’s take a look at how you can make your way through the markets for the next couple of weeks – or as long as the coronavirus epidemic keeps affecting the markets.
How Coronavirus (COVID-19) affecting the Global Economy?
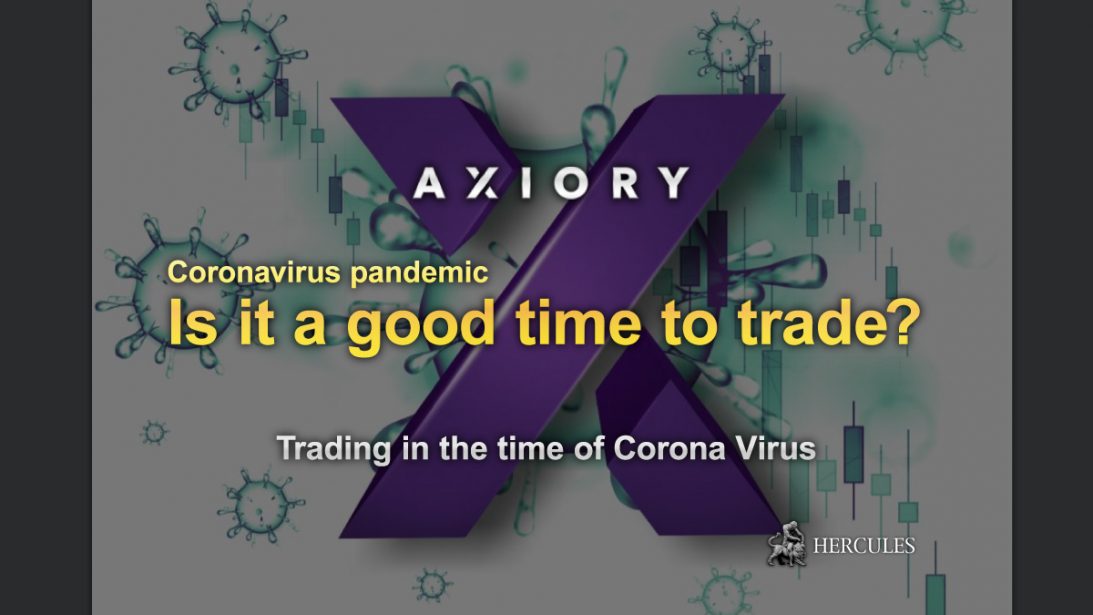
Is it a good time to trade?
It may sound unbelievable, but it’s a great time to at least observe the markets.
It’s extremely risky but it’s like trading bonds; traders who are willing to take a bigger risk, by buying bonds of risky countries, have the potential to enjoy a higher reward.
Traders who jump in on this opportunity can expect a potentially bigger premium, simply because they were the brave ones who continued digging for profits at a time when others ran for safety.
Remember that this approach has always made sense on the stock market and especially when trading shares or indices.
With Axiory, traders can attempt to tackle these markets with our full support and the help of risk management tools which allow you to navigate these unusual markets with that much more caution.
This guide will help you understand market behaviour and see how historically, in times of uncertainty, trading was more alive than ever.
Buy when there’s blood on the streets
The good old saying by Wall Street “buy, when there’s blood on the streets” may sound brutal but it clearly tells you that you should buy at times of extreme panic and fear, when many avoid buying, even though opportunities are arising.
From a market perspective it makes a lot of sense, and traders who do take this advice can be lavishly rewarded.
The question remains, is it really a good time to buy?
The answer is yes … and no! Okay, before you get confused let’s explain.
There’s an epidemic of panic buying and you can also take advantage of it but the smart thing to do is wait for the right occasion which presents the right opportunity.
What I’m saying is that before the market begins a new bull run, all traders who had hope must lose this hope first.
When absolutely everybody loses hope then the market reverses.
Now – at the time of writing – this is not the case.
A fair warning I’ll give you right now is don’t fool yourself by thinking “the market price is so low, it can’t drop any lower”.
The market can always decline, and attempting to catch that rock bottom at the right time is extremely difficult.
There’s no magic trick which guarantees you’ll catch that sweet bit and buy at the right time, but understanding how things happened in the past – and based on the theory that the market repeats itself – then you can be better prepared.
Continue reading to learn more.
Anatomy of the market
Markets are still behaving the way markets do, what does that mean?
Even though movements are more abrupt and we are seeing more downward than upward movements, trading this market is still based on some of the most common principles which have guided traders for decades.
1. The anatomy of fear
Unlike our daily lives, things on the forex market are moving as usual. Yes, we do have a massive outflow from emerging markets’ currencies but the situation is far from the panic and crisis we are seeing around us in the real world.
On the stock market however, the situation is different. The vast majority of market participants there depend on upward price movements to make profits. Yes, they can short sell some stocks, or go short on futures contracts, but that’s a rather small percentage of the overall turnover.
The situation imposed by the coronavirus is unique. We’ve had many recessions and market crashes throughout our economy’s history, but this one is extremely sharp and caused by a non-financial sector; instead it’s mainly driven by the stock market.
2. Fear and greed
Yes, the market is experiencing an unusual situation however traders are in a good place.
During economic crashes there are well-known routes to be followed. Although they can’t guarantee what happens next, these routes are based on historical factors and give us an estimate of what to expect from market patterns.
So what’s the situation now? The market is in a state of panic. A lot of investors are resorting to cash and that creates a depletion of liquidity; lower liquidity creates more volatile movements, volatility creates fear – even though it should only create caution.
The biggest problem at the moment is uncertainty. The same way we are generally anxious about the uncertainty of the situation, markets are very similar. Bad news in the world doesn’t always mean bad news for traders – because they can trade whether the market is moving upwards and downwards.
Uncertainty causes fear because it means they don’t know which direction to take. And this time the level of fear is high because we can’t predict what will happen, if the virus will spread further, if further measures will be taken by countries, and if we’ll be able to contain the virus at all.
What will the new bull run look like?
So, all eyes are on when the market will hit rock bottom and start climbing up, but what will this rise look like?
It’s hard to predict the details of the rise however it’s expected to be a W reversal rather than a V reversal. What does this mean?
In a W reversal traders try to buy the dip, then the price rises before dropping again.
This drop will cause losses for the initial buyers, but then the market price will surge again.
Some experts are even mentioning an L reversal, that means a crash to the bottom followed by a long-time sideways pattern keeping the price at the bottom.
However we can’t precisely predict how the market will move, we can only study what’s happened in the past and what’s happening now to make our own informed decision about what’s to come.
What a time to be alive!
I started trading in 2008, during the great recession … crazy I know! But that helped me develop my skills as a trader and become fully aware of the risks involved in trading and I learnt how to manage risk rather than fear it – after all trading is always risky.
I was shaped by fear, greed and uncertainty which made me strongly base my success on my behaviour.
Traders who only know good times can improve a lot by going through a time like this! The current crash can serve a priceless learning opportunity to those who really love trading.
Market Volatility and Price Behavior
Experts say that the market usually undergoes a correction every decade in a continuous 10-year cycle.
Of course, there are many other fundamental factors like a change in interest rates, quantitative easing, accumulation of debt and over pricing of stock prices which can lead to the formation of a bubble, but based on what we’ve learnt from history the 10-year cycle is more or less the time it takes for the market to correct itself.
1. Sell and Buy instead of Buy and Sell
Let’s try to drop our typical buy and hold attitude towards trading.
Buying is one way of dealing with the markets, when they are moving up; you buy the asset at a certain price and sell when the price goes higher.
But in this market we are looking at overpriced assets which are most likely going to head down.
This means you have to SELL first and buy back when the price drops to make profit.
Currently we are witnessing very wild movements in markets, specifically indices, creating lower circuits – this is when the price gaps downwards at a certain percentage and the exchange freezes the trading.
As a case study I have taken the Dow Jones to help us analyze and understand how the market reacted to a similar market situation in past recessions.
2. A case study of the Dow Jones

When it comes to the Dow Jones the market was on a nice bull run from 2009 all the way up to 2020.
The price had reached the 29500 level before suddenly reversing.
That’s when the coronavirus epidemic began and did its part in pushing the index’s price even lower.
The market was already very much topped out and exhausted.
It’s natural that nothing can infinitely keep moving upwards, at some point it must reverse.
Since the coronavirus epidemic, the market has corrected from it’s all time peak of 29500 dropping down to 19000.
The Dow Jones has dropped 35% within a month.

Let’s go 12 years back to the infamous recession of 2008 and see how the price of the Dow
Jones behaved.
- High price before recession (Sep/2007) 14000
- Lowest price at recession time (March/2009) 6500
- Percentage drop during the recession period 54% in 6 months
We see that the price massively dropped in a considerably short period of time.
Now if we go back to the ‘Sell and then Buy’ attitude we discussed earlier, you’ll see that based on the above example if you had invested $2000 in short positions at the time you could have made approximately $100,000 in a 1-year period.
3. Case Study Takeaways
- It takes more than 10 years for the bull market to reach a peak
- It takes less than 2 years for the bear market to reach its 50%
- Knowing where to exit is key to taking profits before the market reverses
Let’s zoom out a bit and look at the bigger picture.
On the left side you can see the recession period in 2 vertical, red dotted lines.
After the fall during the recession, the market turned upwards and the next bull run began.
From 2009 all the way to 2020 the market was moving upwards with small price corrections – where the price dropped for short periods of time.
DOW Jones – The bigger picture and What’s next
Let’s zoom out a bit and look at the bigger picture.
On the left side you can see the recession period in 2 vertical, red dotted lines.
After the fall during the recession, the market turned upwards and the next bull run began.
From 2009 all the way to 2020 the market was moving upwards with small price corrections – where the price dropped for short periods of time.

The two horizontal blue dotted lines on the chart are the next possible support levels for the Dow Jones – which are the levels where the market can hold for a while before reversing.
- Support level 1 18500
- Support level 2 15500
On the previous chart we saw that the price of the Dow Jones dropped by 50% from its peak during the last recession, this can help us estimate its behaviour during this volatile time – although nothing can ever be certain.
Considering it’s all time high is 29581, a 50% drop would bring it near 14790 (approx 14,000 – 15,000), ideally we look for selling at 15,000 on any price retracements.
By looking at this case study we can get an idea about how the market behaved the last time a recession was building up.
Now every instrument has a slightly different version and of course different prices.
You can study the history of the instrument you are interested in and use the above example as a guide to what you should look for.
How Coronavirus has impacted the financial economy?
Now it’s your turn
If you’ve read everything up to this point then you’re here for a reason; you love trading, or you’re at least curious about trading.
While nothing can guarantee you’ll make the right decision, it’s a glorious time to be part of the markets even if just as an observer.
If you’d like to take the next step Axiory is at your side.
To learn more keep an eye out for live webinars with Tomasz Wisniewski himself about trading the coronavirus and many more topics.
The Axiory Market Analysis Team
Axiory is proud to boast a talented and professional market analysis team lead by Tomasz Wisniewski.
With their expertise and constant monitoring of the markets, they bring you daily analysis and news along with webinars, trading sessions, educational content and great pieces such as this eBook.
-
Official Site
CFD Service. Your capital is at risk.
- Open an Account
- Login
- Detail
- Review